RECENT POSTS
- Introducing modelx-cython: Boosting modelx with Cython Compilation
- A First Look at Python in Excel
- Enhanced Speed for Exported lifelib Models
- New Feature: Export Models as Self-contained Python Packages
- Why you should use modelx
- New MxDataView in spyder-modelx v0.13.0
- Building an object-oriented model with modelx
- Why dynamic ALM models are slow
- Running a heavy model while saving memory
- Running modelx in parallel using ipyparallel
- All posts ...
A First Look at Python in Excel
Sep 3, 2023
A week has passed since Microsoft unveiled the groundbreaking feature: Python in Excel. While there had been whispers of such a feature for years, the official announcement took many in the open-source community and software industry by surprise.
Microsoft has consistently shown its support for open-source technologies, including Python. For instance, they employed Guido van Rossum, the very creator of Python, who recently made an endorsing comment on the introduction of Python in Excel. Furthermore, Python core developers at Microsoft have been actively contributing to enhancing its performance.
The integration of Python in Excel underscores Python’s widespread appeal. Now, employees in large organizations, even those with stringent cybersecurity measures, can readily access Python right from their Excel interface, ensuring data security managed by Microsoft.
We took a first look at Python in Excel. After conducting a quick feature review of Python in Excel, we tried Python in Excel on a task that we typically executed using a Jupyter notebook, evaluating its pros and cons in the process.
Capabilities of Python in Excel
As Microsoft’s announcement clarifies, Python in Excel runs Python on the Microsoft Cloud, not on the user’s local machine.
In this configuration, Excel essentially serves as Python’s user interface, similar to Jupyter notebooks.
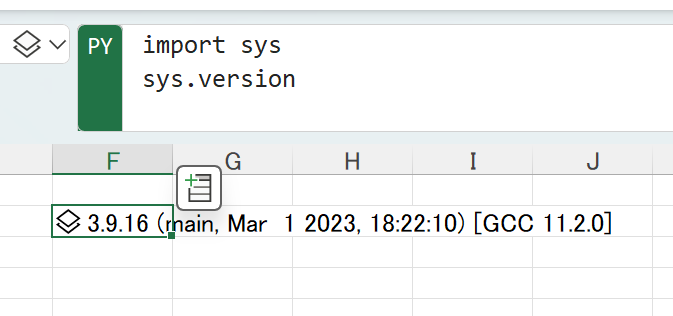
You can start typing Python code in a cell by typing “=PY” then pressing Tab.
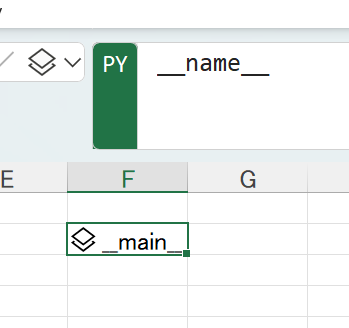
One Python session runs per workbook at a time, with all Python codes in that workbook defined in the __main__ module.
Python cells are executed from the leftmost sheet to the rightmost sheet in the workbook. Within each worksheet, Python cells are executed from the topmost row to the bottom within a given sheet. If a row contains multiple columns with Python cells, those cells are executed from the leftmost column to the right within the row.
It’s important to note that while the “Calculation Options” setting in Excel affects the recalculation timing, it affects all Excel formulas, including the “=PY” function unique to Python in Excel.
Below is the summary of what you can and cannot do with Python in Excel.
You Can:
- Instantly write and run Python code within Excel.
- Bypass installation and library compatibility challenges.
- Create pandas DataFrames from Excel ranges and tables directly.
- Show DataFrame content on worksheets.
- Plot graphs from matplotlib and seaborn in Excel.
You Cannot
- Run Python on your local machine.
- Install Python packages that are not installed by default.
- Create multiple modules or packages.
According to the comment posted by Microsoft’s staff, one of the reasons for confining Python in Excel to the Cloud is to ensure workbook compatibility. This ensures that workbooks shared across users execute consistently, regardless of diverse Excel and Python versions. Considering Microsoft’s track record of supporting even decades-old Excel files, it’s likely they will back Python (and its associated default libraries) in Excel for durations surpassing Python’s standard 5-year version support window.
Testing Python in Excel
First, we quickly checked some variables that indicate settings of the Python environment running on the cloud behind Python in Excel.
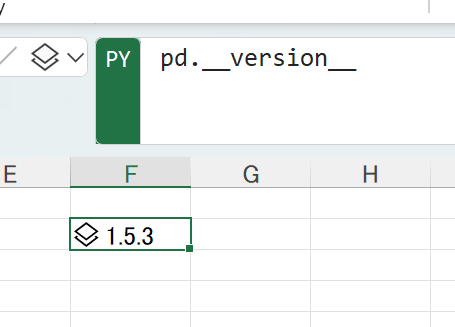
pandas was imported as pd by default, so there was no need to import it first.
The __name__ variable holds the name of the module.
We further tested Python in Excel by creating an Excel workbook that performs part of the task previously performed by cluster_model_points.ipynb, a Jupyter notebook included in the clustered library. The notebook reads cashflow data of 10,000 model points and tries to replicate the cash flow by fewer model points by selecting representative model points using the K-means method, one of the most popular clustering techniques.
You can download the example workbook from here.
The process in the workbook involves two steps.
The first step is to read datasets from other Excel workbooks.
In the Jupyter notebook, pandas read_excel function can be used to load data into pandas DataFrames, but you cannot use it with Python in Excel
because Python runs on the Microsoft Cloud, so it cannot access local files.
Instead, Power Query is used to link the workbook to the data files and load data from there. Three sets of cash flow data were used, one of them is for training and the other two are for testing. Each dataset occupies one entire worksheet.
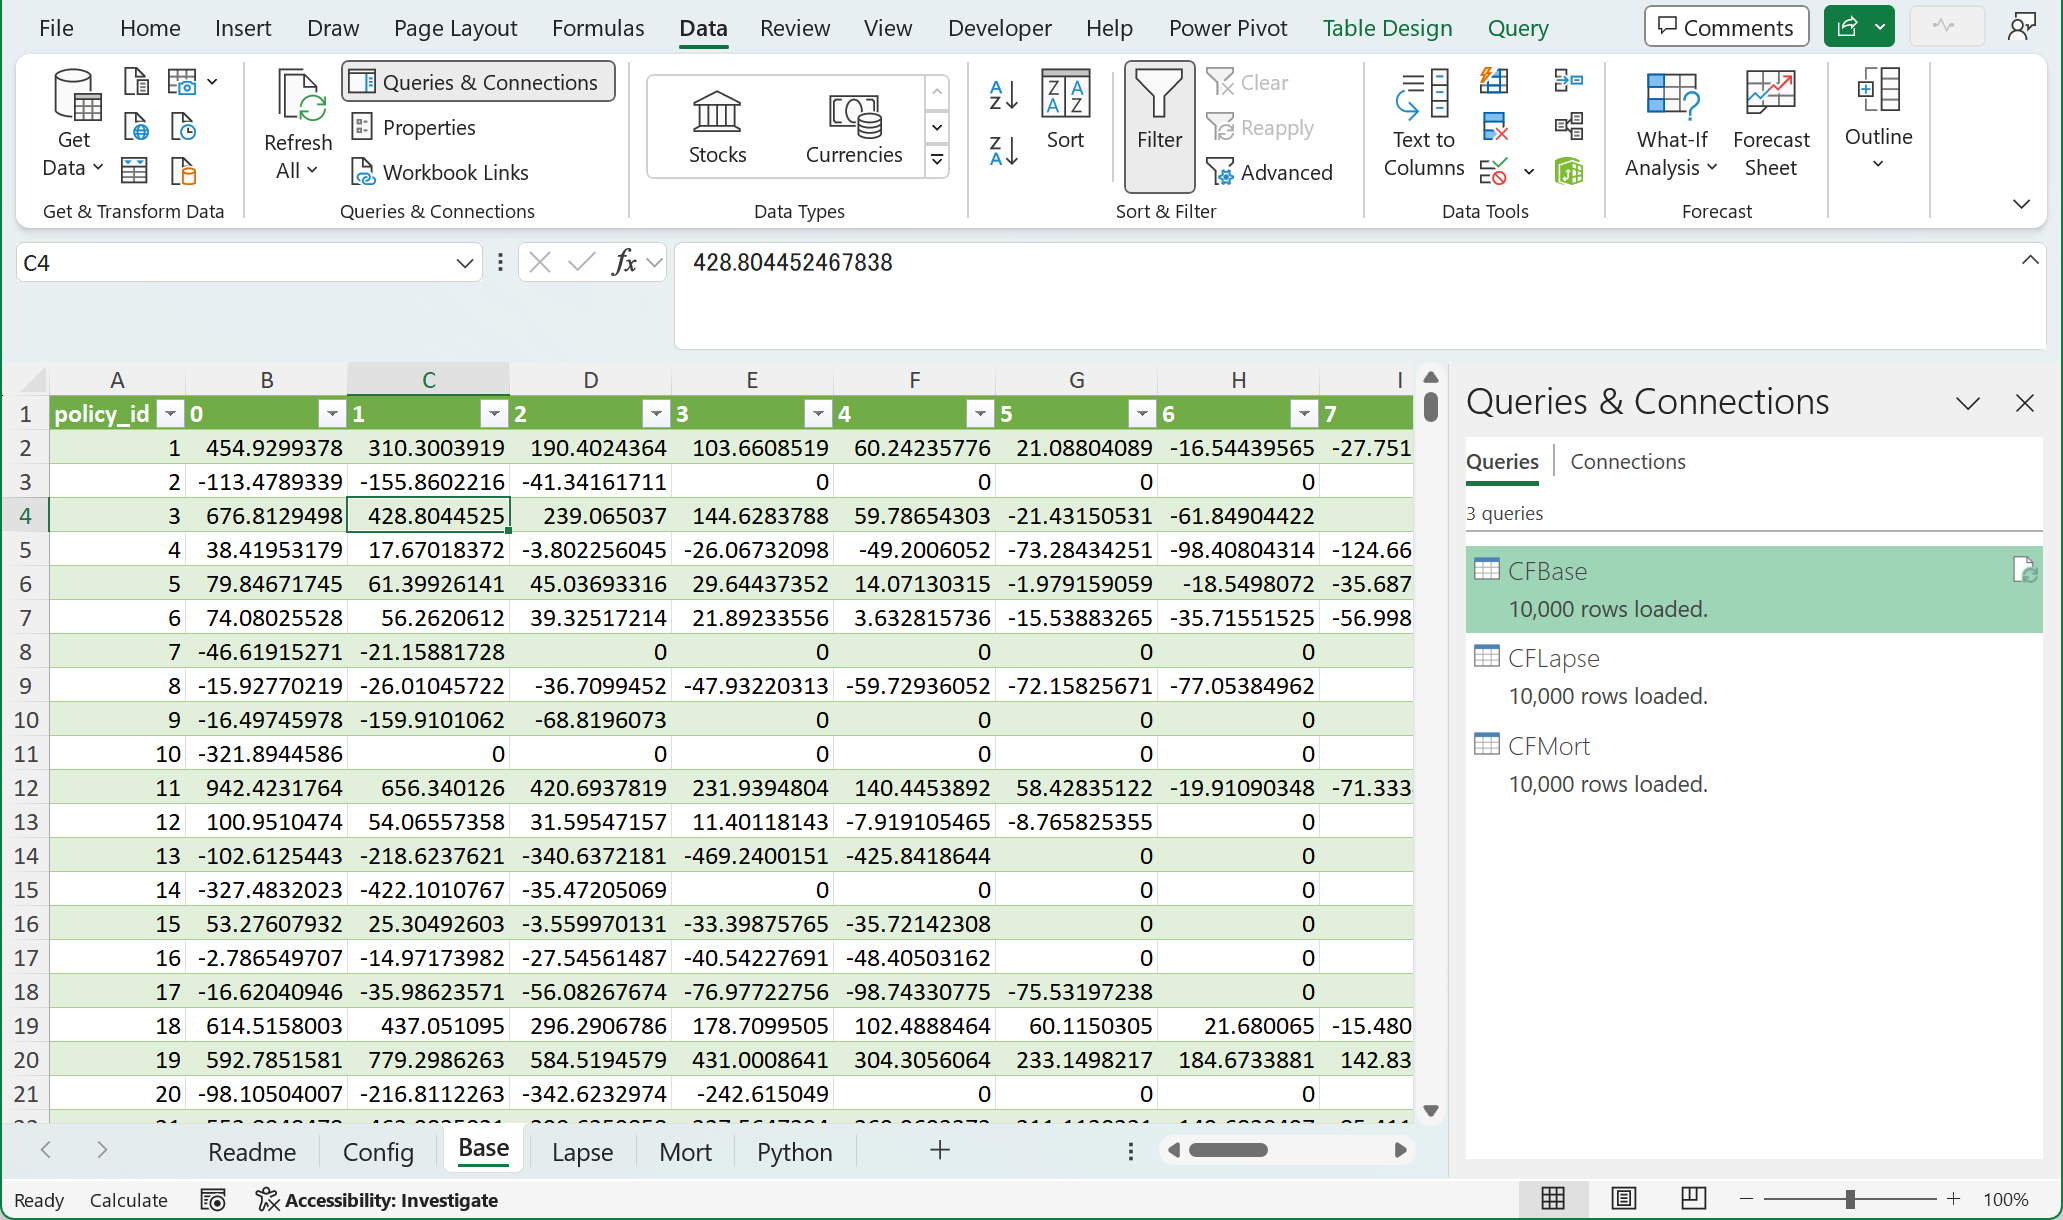
The second step is to write Python code to read data from the imported tables into pandas DataFrames and process them.
The xl function is made available in the global namespace in Python in Excel to create a DataFrame from data on worksheets.
A Python cell shows the object returned by the contained Python code as the Python object icon with the type of the object. You can also output an object such as a DataFrame, Series, numpy array as the values contained in the object spilling from the cell, by selecting “Excel Value” in the Python Output menu.

One notable difference from Jupyter notebook is, while Python statements don’t return values,
simple assignments, such as a = 1; b = 2 in Python in Excel do seem to return the last assigned value to the cell.
Once the cashflow data is available as DataFrames, you can do anything with them in Python using pre-installed libraries. In our example workbook, the Python sheet contains the following Python code:
- Cell G1: Define Cluster, a custom class using scikit-learn
- Cell H1: Define functions to plot custom graphs using matplotlib
Using these custom class and functions, clustering is carried out on the bottom half of the same sheet.
Cell A24 performs the clustering by instantiating the Cluster class, passing cfs, the base cashflows as the training data.
This code is compute-intensive, and sometimes returns “#TIMEOUT”, depending on the resource status on the cloud.
Graphs returned can be enlarged by clicking the cells, and they can be exported as a Picture object from the Create Reference menu.


Concluding Thoughts
Python in Excel seems to be tailored primarily for lightweight data analysis tasks, putting a premium on user-friendliness over heavy-duty data processing. The synergy of Python in Excel with Power Query offers a superb experience for data importing and visualization. However, given its limited recalculation options, Python in Excel might fall short for tasks demanding intense computation. Those seasoned with Jupyter notebooks may not find Python in Excel to be a more efficient tool.
Nevertheless, the immediate access to Python from Excel opens up a world of possibilities for a vast number of Excel users, introducing them to the capabilities of Python. We can anticipate that future enhancements to Python in Excel will likely address its present shortcomings.